


- Systems
- Translated with AI
From Limit Value Verification to Trend Assessment: How Annex 1 Changes Cleanroom Monitoring
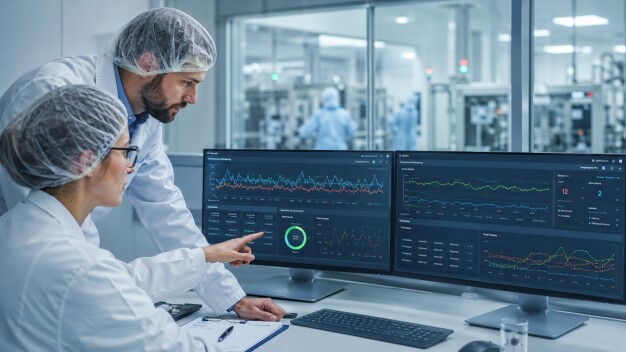
Cleanroom operators today collect a multitude of quality-related data: continuous particle measurements in critical areas, temperature and humidity data, differential pressures, microbiological findings, results from mobile measurements, laboratory information from LIMS systems, as well as status and event data from building management systems. In many facilities, this information is available – but distributed across different systems, databases, and report formats.
This is precisely the central challenge of modern cleanroom monitoring: Not the individual measurement value is decisive, but its evaluation in context. Only when data from different sources are combined and viewed together can correlations, insidious changes, and recurring patterns be reliably recognized.
The revised EU GMP Annex 1 has significantly reinforced this development. For manufacturers of sterile medicinal products, it is a key regulatory driver. It not only requires monitoring of critical cleanroom parameters but also a defined approach to trend evaluation. Monitoring data should serve to detect changes early, assess the effectiveness of contamination control, and derive measures transparently. But companies outside sterile manufacturing also benefit from this approach. Systematic data and trend analyses create transparency, improve process understanding, and support continuous improvement in cleanroom operations.
From individual values to systematic evaluation
For a long time, cleanroom monitoring in many facilities was primarily aimed at proving compliance with defined limits. The central question was: Is the measurement value within the specification or not? This perspective remains relevant but is increasingly insufficient.
Annex 1 shifts the focus more towards developments and patterns. Relevant aspects include rising frequencies of warning or action limit violations, recurring individual events, consecutive exceedances, or changes in microbiological flora. This shifts the emphasis from mere limit proof to trend evaluation.
This development is closely linked to the Contamination Control Strategy (CCS). The CCS describes how contamination risks are systematically controlled. Monitoring data provide an important proof for this because they show whether defined measures are effective or if critical changes are emerging. At the same time, the results must feed into the Quality Risk Management (QRM). When relevant trends are identified, investigations, adjustments of measures, or Corrective and Preventive Actions (CAPA) can be initiated.
The typical starting situation: many data, little correlation
In practice, these requirements often encounter historically grown system landscapes. A cleanroom monitoring system continuously oversees critical areas. Mobile measurement devices provide additional particle or filter data. Microbiological results are stored in a LIMS system, while building management documents ventilation states, operating modes, as well as shuttle or door events. Further information arises from maintenance, cleaning, calibration, or deviation processes.
Each of these systems fulfills its task. The real challenge, however, lies in evaluating this data collectively. Often, information is exported via CSV, PDF, or Excel and then manually incorporated into reports. This is time-consuming, error-prone, and highly dependent on individual persons. But above all, the ability to structurally relate data sources is often missing.
Thus, operators often face not a measurement problem but an analysis and integration problem. Data exists but is siloed. For a reliable and audit-proof evaluation, traceable methods, consistent data sources, defined calculation logic, clear responsibilities, and standardized reviews are necessary.
Info box: Requirements and typical pain points in cleanroom operation
The following overview shows how regulatory and operational expectations often manifest as concrete challenges in practice:


Excel is often the beginning – but rarely the target architecture
Many operators bridge this gap with Excel evaluations, individual macros, or Access databases. This can be practical for point analyses. However, clear limitations arise for recurring GMP-relevant trend evaluations. Calculation logic is not always documented, versions are difficult to trace, access rights are only limitedly controllable, and changes are not automatically auditable.
Once data analyses form the basis for GMP-relevant decisions, the evaluation tools used must also be considered accordingly. Not only primary systems but also downstream analysis and reporting solutions come into focus. Topics such as user rights, audit trail, data integrity, validation, change management, and traceability become central.
The goal is not to generate as many diagrams as possible. It is crucial that operators can transparently explain how data is selected, combined, evaluated, and assessed – professionally, technically, and organizationally.
What cleanroom operators should do now
The first step is to systematically capture the existing data landscape. What data sources exist? Which parameters are critical? Which correlations are particularly relevant for assessing the cleanroom status?
Building on this, operators should define which trend analyses are to be conducted regularly. This includes, for example, long-term evaluations of particle or climate data, frequencies of warning and alarm events, developments in microbiological results, comparisons between rooms or measurement points, and correlations with relevant operational information. Clear review cycles and responsibilities are equally important.
Technically, solutions are needed that can connect various data sources, historize data consistently, visualize flexibly, and generate reproducible reports. Organizationally, SOPs, responsibilities, and evaluation logic must be adapted. Methodologically, a pragmatic yet audit-proof approach is required that proves itself in daily practice and can be clearly explained during audits.
CleanroomTrendPro: Breaking down data silos, making correlations visible
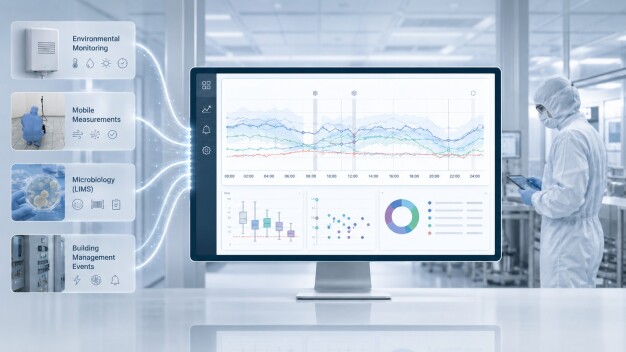
This is exactly where eurogard’s CleanroomTrendPro comes into play. The solution was developed to support cleanroom operators in structured, traceable data and trend analysis. The focus is not only on evaluating individual measurement values but also on integrating various data sources into a unified analysis context.
CleanroomTrendPro can incorporate data from existing monitoring systems, mobile measurements, LIMS environments, building management, and other relevant sources. This allows measurement values, events, and contextual information to be viewed together. Trends are not evaluated in isolation but interpreted in relation to operational activities.
This provides operators with a significantly more comprehensive picture of their cleanroom. Short- and long-term trends can be visualized, limit and warning values systematically assessed, recurring patterns identified, and reports generated transparently. This creates transparency for quality assurance, technology, and operations – and supports a well-founded evaluation in terms of CCS, QRM, and CAPA.
eurogard not only offers a software solution but also brings expertise from GMP, cleanroom, and digitization projects. This combination of cleanroom understanding, data integration, and validation-oriented implementation makes eurogard a competent partner for operators aiming to better utilize their existing data and establish future-proof trend evaluations.
Conclusion
Annex 1 does not change cleanroom monitoring because more data suddenly need to be collected. The real change lies in how existing data should be used. Operators must recognize developments, understand correlations, and document quality-relevant decisions transparently.
It is usually not enough to simply add some curves to existing standard reports. A structured approach is required that connects data sources, defines trend methods, standardizes evaluations, and integrates results into overarching quality processes. Even outside sterile manufacturing, this approach offers clear added value: more transparency, better process understanding, and earlier risk detection.
With CleanroomTrendPro, eurogard supports cleanroom operators in implementing this transition from limit proof to comprehensive trend evaluation in practice.
Sources and further orientation
– European Commission: EU GMP Guidelines, Volume 4, Annex 1: Manufacture of Sterile Medicinal Products
– European Commission: EU GMP Guidelines, Volume 4, Annex 11: Computerised Systems
– ICH Q9: Quality Risk Management
– U.S. FDA: 21 CFR Part 11 – Electronic Records; Electronic Signatures
– MHRA: GxP Data Integrity Guidance and Definitions

eurogard GmbH
Kasernenstraße 22
52064 Aachen
Germany
Phone: +49 2407 95160
email: peter.becker@eurogard.de
Internet: http://www.eurogard.de


